
|
|
The Model
|
|
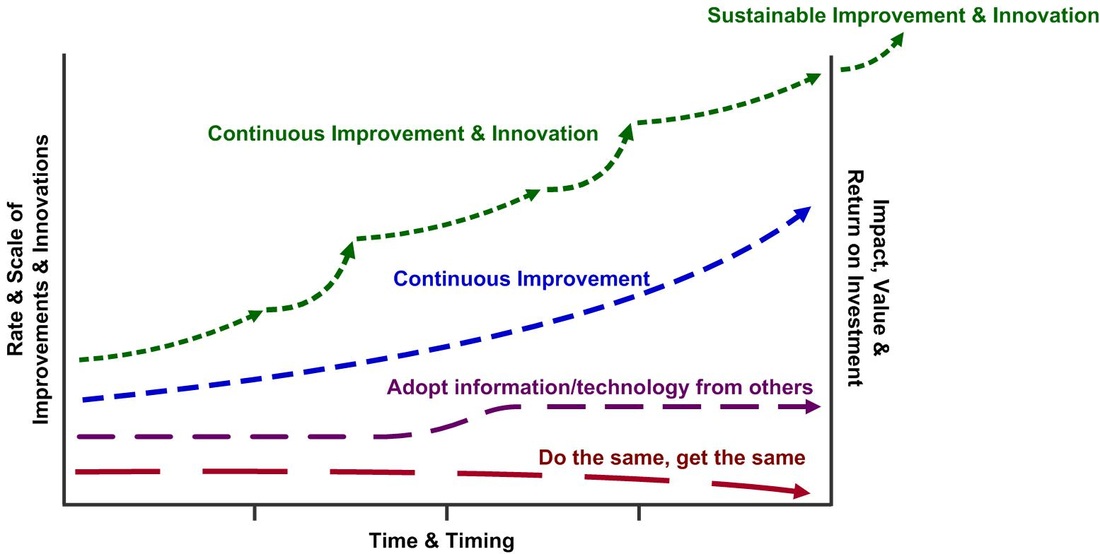
Figure 1
Representing the likely value over time from SI&I relative to other approaches.
Representing the likely value over time from SI&I relative to other approaches.
|
|
The red line shows ‘business as usual’ – do the same, get the same. In today’s rapidly changing world if all we do is what we’ve always done we are likely to fall behind the game.
The purple line shows the impact when the main source of improvements is information and technology provided by others. Impact is achieved, but the pace of improvement depends on the speed of technology development. It also depends on other factors like the fit of the technology within current business systems. The blue line shows the steady returns achieved from successful continuous improvement approaches. The green line shows the value from applying a process that combines both continuous improvement and continuous innovation. Combining this CI&I process with the other elements in the SI&I system, ensures impact is sustained and continues to grow (green-coloured line). |
|