
|
|
|
The purpose of a Gantt Chart is to enable individuals and teams to visualise and manage steps and activities in a process or project.
A Gantt Chart is a horizontal bar chart that graphically displays the time relationship of the steps in a process or project. It is named after Henry Gantt, the industrial engineer who introduced the procedure in the early 1900s. Steps in creating a Gantt chart 1. Develop a clear Focus for the process or project. 2. List the steps required to complete a processes or project. 3. Estimate the time required for each step. 4. List the steps down the left side of the chart and time intervals along the bottom. 5. Draw a line across the chart for each step, starting at the planned beginning date and ending on the completion date of that step. When your Gantt Chart is finished, you will be able to see the minimum total time for the project, the proper sequence of steps, and which steps can be under way at the same time. You can add to the usefulness of a Gantt Chart by also charting actual progress. This is usually done by drawing a line in a different colour below the original line to show the actual beginning and ending dates of each step. This allows you to quickly assess whether or not the project is on schedule. Gantt Charts are limited in their ability to show the interdependencies of activities. In projects or processes where the steps flow in a simple sequence of events, Gantt Charts can portray adequate information for effective management. However, when several steps are under way at the same time and there is a high level of interdependency between the various steps, PERT Diagrams are a better choice. An example Gantt Chart is shown below. 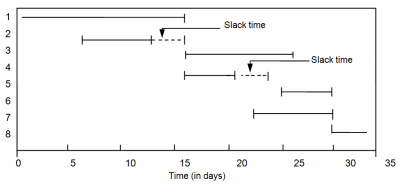
|
|